Market Outlook
October 18, 2017
Market Cues
Domestic Indices
Chg (%)
(Pts)
(Close)
Indian markets are likely to open flat tracking global indices and SGX Nifty.
BSE Sensex
(0.1)
(24)
32,609
After ending the previous session modestly higher, US markets showed a lack of
Nifty
0.0
4
10,234
direction over the course of the trading day on Tuesday. Traders largely shrugged
Mid Cap
0.4
64
16,115
off some upbeat economic data, including a report from the Federal Reserve
Small Cap
0.5
90
17,066
showed that industrial production rose by 0.3 percent in September after sliding by
Bankex
(0.2)
(67)
27,682
0.7 percent in August. Despite the choppy trading on the day, the Dow and the S&P
500 reached new record closing highs. While the tech-heavy Nasdaq edged down
by a less than a tenth of a percent to 6,624, the Dow edged up 0.2 percent to
Global Indices
Chg (%)
(Pts)
(Close)
22,997 and the S&P 500 inched up 0.1 percent to 2,559.
Dow Jones
0.2
40
22,997
The UK markets finished lower on Tuesday after investors received inflation data that
Nasdaq
(0.0)
(0)
6,624
could harden the case for the Bank of England to raise British borrowing costs. The
FTSE
(0.1)
(11)
7,516
FTSE 100 index fell 0.1% to close at 7,516, after darting between small gains and
Nikkei
0.4
81
21,336
losses through the day.
Hang Seng
0.0
5
28,697
In India, Nifty ended little changed on Tuesday after hitting a third consecutive high
Shanghai Com
(0.2)
(6)
3,372
earlier in the day, as investors remained on the sidelines ahead of a long Diwali
weekend amid anticipation of a correction in overbought counters. BSE Sensex
Advances / Declines
BSE
NSE
closed lower by 24 points to 32,609, while the Nifty 50 edged up 4 points to close
Advances
1,368
844
at a new peak, 10,234.
Declines
1,339
840
News Analysis
Unchanged
123
90
Wipro - 2QFY18 result update
Bajaj Auto - 2QFY18 result update
Volumes (` Cr)
Detailed analysis on Pg2
BSE
3,136
NSE
28,043
Investor’s Ready Reckoner
Key Domestic & Global Indicators
Net Inflows (` Cr)
Net
Mtd
Ytd
Stock Watch: Latest investment recommendations on 150+ stocks
FII
(1,555)
(4,408)
32,122
Refer Pg5 onwards
MFs
9
5,182
91,525
Top Picks
CMP
Target
Upside
Top Gainers
Price (`)
Chg (%)
Company
Sector
Rating
(`)
(`)
(%)
Idea
90
8.4
Blue Star
Capital Goods Accumulate
798
867
8.7
Dewan Housing Finance
Financials
Accumulate
592
630
6.4
Vakrangee
538
7.3
Asian Granito
Other
Buy
489
570
16.6
Dbl
799
7.3
Navkar Corporation
Other
Buy
194
265
37.0
Bbtc
1,648
6.7
KEI Industries
Capital Goods
Buy
326
380
16.6
Sreinfra
116
6.1
More Top Picks on Pg4
Key Upcoming Events
Top Losers
Price (`)
Chg (%)
Previous
Consensus
Date
Region
Event Description
Religare
48
(5.0)
Reading
Expectations
Oct 18
UK
CPI (YoY)
3.00
3.00
Welspunind
61
(3.8)
Oct 18
US
Building permits
1,272.00
1,245.00
Zeel
495
(3.7)
Oct 18
China
Industrial Production (YoY)
6.00
6.50
Dcbbank
184
(3.2)
Oct 19
UK
Jobless claims change
(2.80)
Trent
314
(2.8)
Oct 19
US
Initial Jobless claims
243.00
240.00
As on October, 17 2017
More Events on Pg7
Market Outlook
October 18, 2017
News Analysis
Wipro - 2QFY18 result update
Wipro announced its 2QFY2018 results today. The company posted a 2.2%
sequential growth in USD revenues to US$2,015mn. In rupee terms, revenues
came in at `13,681cr, up 0.4% qoq. EBIT margin is expected to show an
expansion of ~71bp qoq to end the period at 15.9% on account of strong growth.
Consequently, PAT came in at `2,084cr, a rise of 0.1% qoq. We maintain our
neutral rating on the stock.
Y/E
Sales OPM
PAT
EPS ROE P/E P/BV EV/EBITDA EV/Sales
March
(` cr)
(%)
(` cr)
(`)
(%)
(x)
(x)
(x)
(x)
FY2017E
58,536
20.3
8,863
18.2
14.6
15.9
2.5
8.4
1.7
FY2018E
61,858
20.3
9,276
19.1
13.4
15.2
2.1
7.3
1.5
Bajaj Auto - 2QFY18 result update
Bajaj Auto’s reported revenue growth of 8.7% to `6,580cr, PAT declined by 1% yoy
to `1,112cr. EBITDA was flat at Rs 1,298cr as margins declined by 168bps yoy to
19.7%. On sequential basis however the numbers have shown improvement with
revenue/PAT growth of 20.9% and 20.3% respectively. EBITDA margins also grew
by 250bps on sequential basis.
Company has indicted the new export markets now contribute 16% of the total
volumes vs. 10%/6% in FY17/FY16 respectively. Company has hinted that the
Nigeria, Bangladesh and Philippines are likely to be supportive of future growth
with healthy order book for Oct-17. In the domestic segment, company has
indicated of strong outlook for 3Ws.
Overall we believe that this is a decent result, especially after the weak set of
results in the last quarter when top line/bottom line declined marginally and
margins had dropped on yoy and qoq basis. This quarter has also shown recovery
in the domestic and export volumes and blended realization are up 4.8% yoy.
Company has indicated that it will be allocating the 3W exports capacity for
domestic 3W volumes. We believe that Bajaj Auto is on recovery path and going
ahead, there is a room for improvement. We maintain accumulate rating.
Economic and Political News
WPI India rejects WTO push for new global e-commerce rules
Martin Sorrell says he remains bullish on India
Cooling inflation and rebound in exports and industrial production suggest a
favorable shift in India’s economic climate
Corporate News
Axis Bank Q2 net jumps 36% to Rs 432 cr but bad loans rise
Many one-offs dent Axis Bank's Q2 show
Flipkart talking with Kishore Biyani to buy 8-10% stake in Future Lifestyle
Fashions
Market Outlook
October 18, 2017
Quarterly Bloomberg Brokers Consensus Estimate
UltraTech Cement Ltd - Oct 18, 2017
Particulars ( ` cr)
2QFY18E
2QFY17
y-o-y (%)
1QFY18 q-o-q (%)
Sales
6,405
5,458
17.3
6,626
(3.4)
EBIDTA
1,155
1,154
0.01
1,560
(25.9)
%
18.1
21.1
23.5
PAT
382
601
(36.4)
890
(57.1)
Market Outlook
October 18, 2017
Top Picks HHHHH
Market Cap
CMP
Target
Upside
Company
Rationale
(` Cr)
(`)
(`)
(%)
Strong growth in domestic business due to its leade`hip
in acute therapeutic segment. Alkem expects to launch
Alkem Laboratories
21,809
1,824
2,079
14.0
more products in USA, which bodes for its international
business.
We expect the company would report strong profitability
Asian Granito
1,471
489
570
16.6
owing to better product mix, higher B2C sales and
amalgamation synergy.
Favorable outlook for the AC industry to augur well for
Cooling products business which is out pacing the
Blue Star
7,638
798
867
8.7
market growth. EMPPAC division's profitability to
improve once operating environment turns around.
With a focus on the low and medium income (LMI)
consumer segment, the company has increased its
Dewan Housing Finance
18,557
592
630
6.4
presence in tier-II & III cities where the growth
opportunity is immense.
Loan growth is likely to pick up after a sluggish FY17.
Lower credit cost will help in strong bottom-line growth.
Karur Vysya Bank
7,717
128
180
41.0
Increasing share of CASA will help in NIM
improvement.
High order book execution in EPC segment, rising B2C
KEI Industries
2,536
326
380
16.6
sales and higher exports to boost the revenues and
profitability
Expected to benefit from the lower capex requirement
Music Broadcast
2,204
386
434
12.4
and 15 year long radio broadcast licensing.
Massive capacity expansion along with rail advantage
Navkar Corporation
2,759
194
265
37.0
at ICD as well CFS augur well for the company
Strong brands and distribution network would boost
Siyaram Silk Mills
2,506
2,674
2,856
6.8
growth going ahead. Stock currently trades at an
inexpensive valuation.
Market leaderhip in Hindi news genre and no.
2
viewe`hip ranking in English news genre, exit from the
TV Today Network
2,105
353
435
23.3
radio business, and anticipated growth in ad spends by
corporates to benefit the stock.
After GST, the company is expected to see higher
volumes along with improving product mix. The Gujarat
Maruti Suzuki
2,37,119
7,850
8,658
10.3
plant will also enable higher operating leverage which
will be margin accretive.
We expect loan book to grow at 24.3% over next two
GIC Housing
2,734
508
655
29.0
year; change in borrowing mix will help in NIM
improvement..
Source: Company, Angel Research
Market Outlook
October 18, 2017
Key Upcoming Events
Result Calendar
Date
Company
October 18, 2017
Ultra Tech cement
October 23, 2017
Hindustan Zinc
Source: Bloomberg, Angel Research
Global economic events release calendar
Bloomberg Data
Date
Time
Country
Event Description
Unit
Period
Last Reported
Estimated
Oct 18, 2017
2:00 PMUK
CPI (YoY)
% Change
Sep
3.00
3.00
6:00 PMUS
Building permits
Thousands
Sep
1,272.00
1,245.00
7:30 AMChina
Industrial Production (YoY)
% Change
Sep
6.00
6.50
Oct 19, 2017
2:00 PMUK
Jobless claims change
% Change
Sep
(2.80)
6:00 PMUS
Initial Jobless claims
Thousands
Oct 14
243.00
240.00
7:30 AMChina
Real GDP (YoY)
% Change
3Q
6.90
6.80
Oct 20, 2017
7:30 PMUS
Existing home sales
Million
Sep
5.35
5.30
Oct 23, 2017
7:30 PMEuro Zone Euro-Zone Consumer Confidence
Value
Oct A
(1.20)
Oct 24, 2017
1:00 PMGermany PMI Manufacturing
Value
Oct P
60.60
1:00 PMGermany PMI Services
Value
Oct P
55.60
Oct 25, 2017
2:00 PMUK
GDP (YoY)
% Change
3Q A
1.50
1.50
7:30 PMUS
New home sales
Thousands
Sep
560.00
550.00
Oct 26, 2017
5:15 PMEuro Zone ECB announces interest rates
%
Oct 26
-
Oct 27, 2017
6:00 PMUS
GDP Qoq (Annualised)
% Change
3Q A
3.10
2.50
Oct 31, 2017
7:30 PMUS
Consumer Confidence
S.A./ 1985=100
Oct
119.80
120.00
Source: Bloomberg, Angel Research
Market Outlook
October 18, 2017
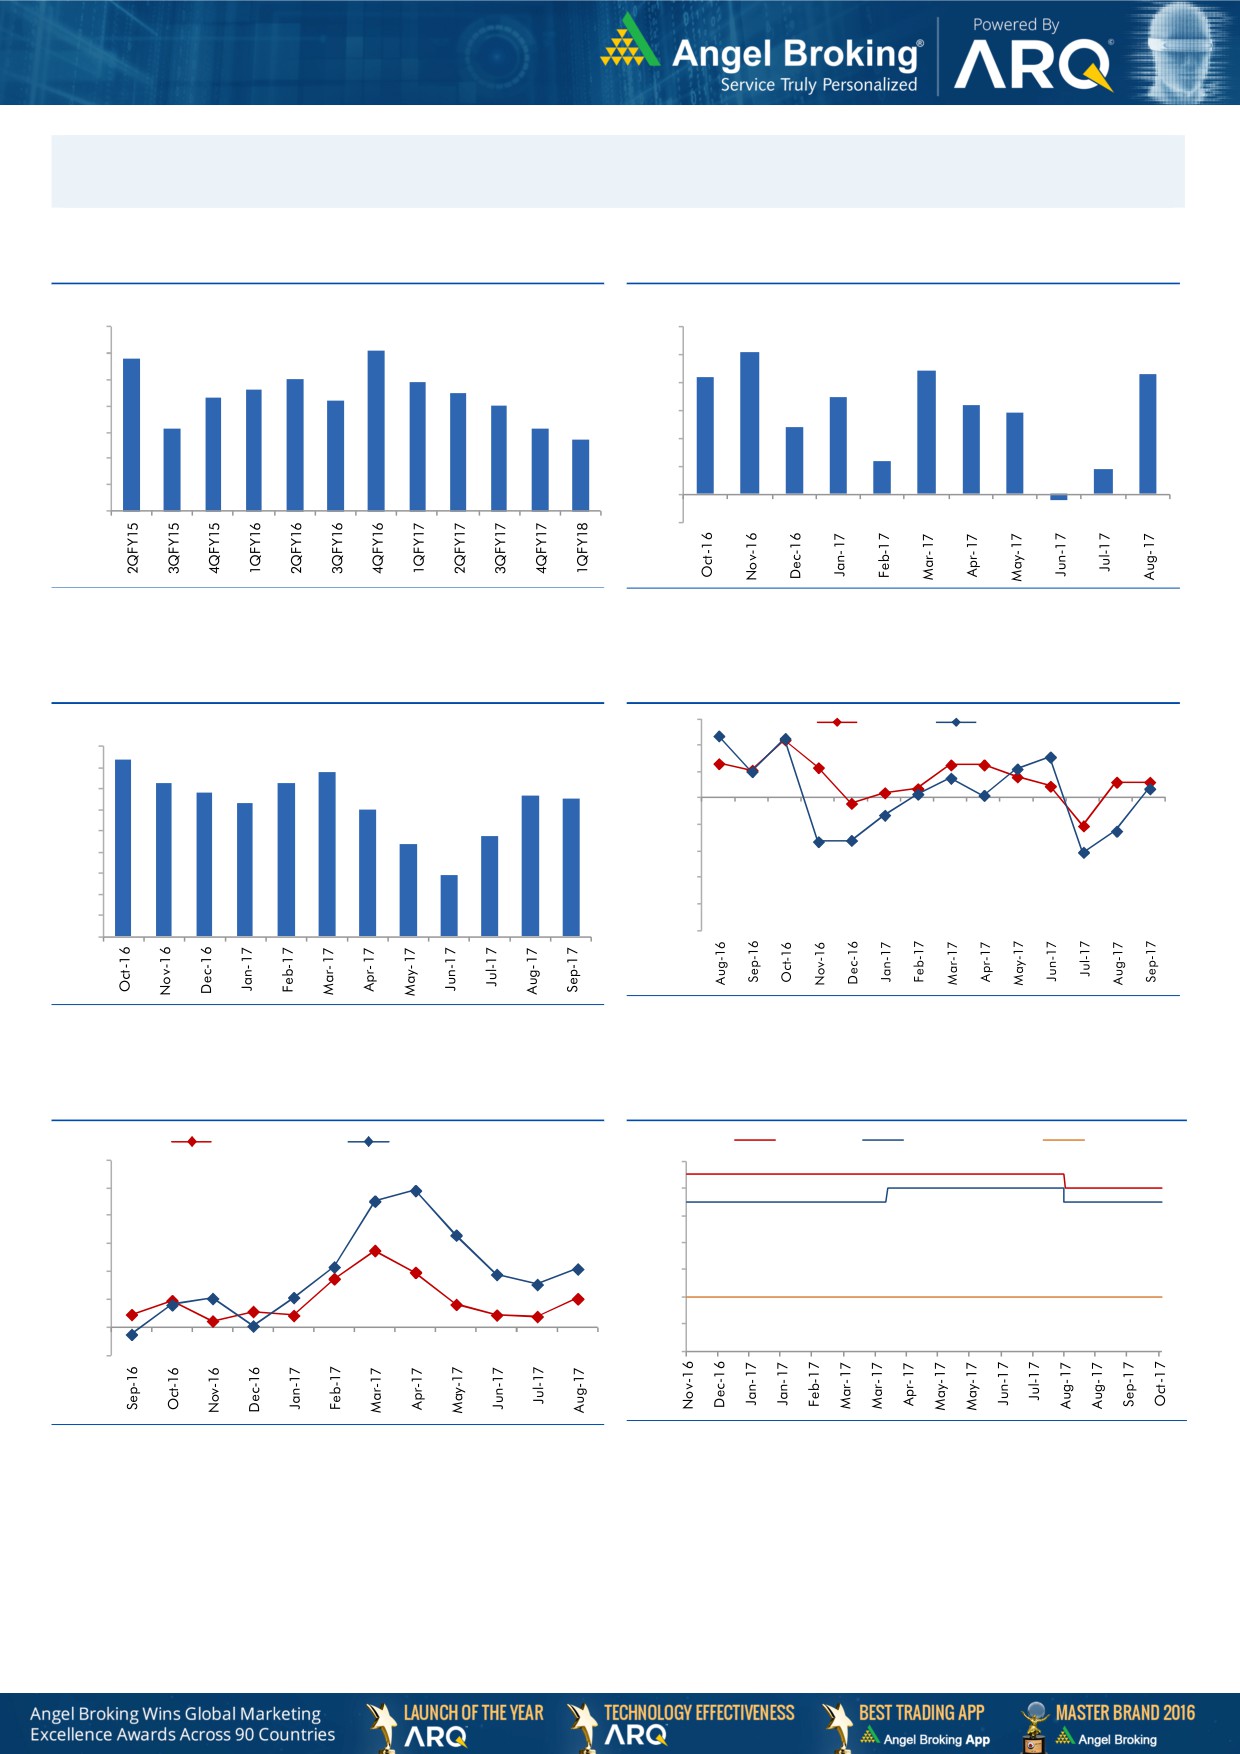
Macro watch
Exhibit 1: Quarterly GDP trends
Exhibit 2: IIP trends
(%)
(%)
10.0
6.0
9.1
5.1
8.8
9.0
5.0
4.4
4.3
8.0
7.9
4.2
7.6
7.5
8.0
7.3
7.2
4.0
3.5
7.0
3.2
2.9
7.0
6.1
6.1
3.0
2.4
5.7
6.0
2.0
1.2
0.9
5.0
1.0
4.0
-
3.0
(1.0)
(0.2)
Source: CSO, Angel Research
Source: MOSPI, Angel Research
Exhibit 3: Monthly CPI inflation trends
Exhibit 4: Manufacturing and services PMI
56.0
Mfg. PMI
Services PMI
(%)
4.5
4.2
54.0
3.9
4.0
3.6
3.7
3.4
3.4
52.0
3.2
3.3
3.5
3.0
50.0
3.0
2.2
2.4
48.0
2.5
2.0
46.0
1.5
1.5
44.0
1.0
42.0
0.5
40.0
-
Source: Market, Angel Research; Note: Level above 50 indicates expansion
Source: MOSPI, Angel Research
Exhibit 5: Exports and imports growth trends
Exhibit 6: Key policy rates
(%)
Exports yoy growth
Imports yoy growth
(%)
Repo rate
Reverse Repo rate
CRR
60.0
6.50
50.0
6.00
40.0
5.50
30.0
5.00
20.0
4.50
10.0
4.00
0.0
3.50
(10.0)
3.00
Source: Bloomberg, Angel Research
Source: RBI, Angel Research
Market Outlook
October 18, 2017
Global watch
Exhibit 1: Latest quarterly GDP Growth (%, yoy) across select developing and developed countries
(%)
8.0
6.9
7.0
5.8
6.0
5.3
5.0
5.0
1.1
3.7
4.0
2.5
3.0
2.2
1.8
2.0
1.5
1.4
0.8
1.0
0.3
-
Source: Bloomberg, Angel Research
Exhibit 2: 2017 GDP Growth projection by IMF (%, yoy) across select developing and developed countries
(%)
6.7
6.8
7.0
6.0
5.4
5.2
5.0
3.7
4.0
3.0
1.8
2.2
2.0
1.7
1.6
2.0
0.7
1.5
0.7
1.0
-
Source: IMF, Angel Research
Exhibit 3: One year forward P-E ratio across select developing and developed countries
(x)
25.0
20.0
15.0
10.0
5.0
-
Source: IMF, Angel Research
Market Outlook
October 18, 2017
Exhibit 4: Relative performance of indices across globe
Returns (%)
Country
Name of index
Closing price
1M
3M
1YR
Brazil
Bovespa
76,201
2.8
17.5
26.0
Russia
Micex
2,093
2.1
7.4
6.5
India
Nifty
10,234
1.5
3.5
19.2
China
Shanghai Composite
3,372
0.2
5.5
12.2
South Africa
Top 40
51,510
4.0
8.4
17.0
Mexico
Mexbol
50,141
(0.8)
(2.7)
3.4
Indonesia
LQ45
992
1.8
1.4
7.5
Malaysia
KLCI
1,749
(1.8)
(0.3)
5.0
Thailand
SET 50
1,105
4.0
10.5
19.1
USA
Dow Jones
22,997
3.4
6.1
26.9
UK
FTSE
7,516
4.2
1.7
7.0
Japan
Nikkei
21,336
7.4
6.2
25.3
Germany
DAX
12,995
3.7
4.7
21.5
France
CAC
5,361
2.8
2.8
18.0
Source: Bloomberg, Angel Research, p68in4
Stock Watch
October 18, 2017
Company Name
Reco
CMP
Target
Mkt Cap
Sales ( Čcr )
OPM(%)
EPS (Č)
PER(x)
P/BV(x)
RoE(%)
EV/Sales(x)
(Č)
Price ( Č)
( Č cr )
FY18E FY19E
FY18E
FY19E
FY18E
FY19E
FY18E
FY19E
FY18E
FY19E
FY18E
FY19E
FY18E
FY19E
Agri / Agri Chemical
Rallis
Reduce
236
209
4,588
1,873
2,099
15.0
15.0
9.5
10.5
24.8
22.5
3.8
3.4
15.8
16.0
2.3
2.1
United Phosphorus
Neutral
803
-
40,818
18,922
21,949
18.0
18.5
36.2
45.6
22.2
17.6
4.6
3.8
22.7
23.8
2.3
1.9
Auto & Auto Ancillary
Ashok Leyland
Neutral
128
-
37,518
23,339
27,240
10.1
10.8
4.7
6.2
27.6
20.6
5.5
4.9
20.0
23.6
1.6
1.3
Bajaj Auto
Neutral
3,264
-
94,441
23,936
27,955
19.5
20.1
142.7
167.3
22.9
19.5
5.0
4.5
21.8
22.8
3.5
3.0
Bharat Forge
Buy
635
875
29,558
7,637
8,755
21.7
23.2
36.1
47.3
17.6
13.4
3.2
2.7
18.5
20.8
3.7
3.2
Eicher Motors
Neutral
31,829
-
86,647
19,043
22,837
19.5
19.9
835.4
1,019.0
38.1
31.2
14.2
11.0
40.9
37.8
4.4
3.6
Gabriel India
Neutral
201
-
2,894
1,782
2,033
9.7
10.2
7.1
8.9
28.4
22.8
5.7
4.8
21.0
22.2
1.6
1.4
Hero Motocorp
Accumulate
3,789
4,129
75,672
32,239
36,878
16.0
15.6
184.4
206.5
20.6
18.4
6.5
5.7
31.3
30.7
2.1
1.8
Jamna Auto Industries Neutral
59
-
2,359
1,441
1,662
14.4
14.8
13.9
17.6
4.3
3.4
1.2
0.9
30.0
31.0
1.6
1.4
Mahindra and Mahindra Neutral
1,373
-
85,301
46,971
53,816
13.6
14.0
67.7
79.8
20.3
17.2
2.9
2.6
15.0
15.9
1.7
1.4
Maruti
Accumulate
7,850
8,658
237,119
81,825
101,245
15.0
15.0
283.5
356.0
27.7
22.1
6.1
4.9
21.9
22.4
2.6
2.0
Minda Industries
Neutral
846
-
7,307
4,328
5,084
11.0
11.9
27.3
36.4
31.0
23.2
6.6
5.1
23.1
25.6
1.8
1.5
Motherson Sumi
Neutral
355
-
74,818
55,937
64,445
10.8
11.4
16.9
21.1
21.0
16.9
4.7
4.8
25.2
25.4
1.4
1.2
Tata Motors
Neutral
432
-
124,733
303,167
343,649
11.8
13.8
33.1
54.7
13.1
7.9
2.1
1.7
16.9
23.0
0.5
0.4
TVS Motor
Neutral
689
-
32,738
13,992
16,216
9.0
9.4
17.1
20.3
40.4
34.0
10.7
8.3
29.7
27.7
2.3
1.9
Amara Raja Batteries
Buy
694
858
11,853
6,140
7,122
14.3
15.6
29.3
39.0
23.7
17.8
4.0
3.4
17.1
19.0
1.9
1.7
Exide Industries
Neutral
208
-
17,684
8,689
9,854
15.1
15.2
9.7
11.0
21.6
18.9
3.8
3.4
15.7
16.1
1.8
1.5
Apollo Tyres
Neutral
245
-
12,494
15,739
17,326
13.3
14.6
20.4
26.7
12.0
9.2
1.5
1.3
20.4
26.7
1.0
0.9
Ceat
Neutral
1,736
-
7,024
6,661
7,717
11.1
14.2
116.2
178.2
15.0
9.8
2.6
2.2
15.2
21.3
1.2
1.0
JK Tyres
Neutral
150
-
3,395
8,318
9,239
16.2
16.4
21.0
27.5
7.2
5.4
1.4
1.1
19.1
20.4
0.9
0.7
Swaraj Engines
Neutral
2,013
-
2,500
788
889
16.4
16.5
71.6
81.0
28.1
24.9
8.1
7.5
29.6
31.0
2.8
2.5
Subros
Neutral
251
-
1,505
1,855
2,135
11.6
11.8
10.3
14.7
24.5
17.1
3.7
3.2
15.8
19.1
1.0
0.9
Capital Goods
BEML
Neutral
1,782
-
7,421
4,286
5,194
7.1
8.2
42.9
58.1
41.5
30.7
3.4
3.1
7.6
8.7
1.8
1.5
Bharat Electronics
Neutral
171
-
41,978
10,258
12,470
19.6
19.5
7.3
8.6
23.4
19.9
0.5
0.4
20.4
21.9
3.6
2.9
Voltas
Neutral
538
-
17,803
6,778
8,004
9.6
11.0
17.1
22.4
31.5
24.0
7.5
6.6
17.7
19.8
2.3
2.0
BHEL
Neutral
84
-
30,913
33,200
39,167
6.8
9.5
6.2
11.2
13.6
7.5
0.6
0.6
4.6
8.0
0.5
0.4
Blue Star
Accumulate
798
867
7,638
5,220
6,207
6.3
6.6
16.8
22.3
47.5
35.8
9.4
8.3
19.9
23.3
1.4
1.2
CG Power and Industrial
Neutral
79
-
4,967
6,555
7,292
7.5
7.5
-
0.8
7,925.0
99.1
1.2
1.2
0.1
1.2
0.8
0.8
Solutions
Greaves Cotton
Neutral
131
-
3,192
1,778
1,993
14.7
15.1
8.1
9.1
16.1
14.4
3.6
3.4
21.8
23.6
1.6
1.4
Stock Watch
October 18, 2017
Company Name
Reco
CMP
Target
Mkt Cap
Sales ( Čcr )
OPM(%)
EPS (Č)
PER(x)
P/BV(x)
RoE(%)
EV/Sales(x)
(Č)
Price ( Č)
( Č cr )
FY18E FY19E
FY18E
FY19E
FY18E
FY19E
FY18E
FY19E
FY18E
FY19E
FY18E
FY19E
FY18E
FY19E
Capital Goods
KEC International
Buy
299
350
7,684
9,779
11,113
9.4
9.8
14.2
18.2
21.1
16.4
4.0
3.3
21.1
22.1
1.0
0.9
KEI Industries
Buy
326
380
2,536
3,001
3,391
10.0
10.0
13.0
16.1
25.1
20.2
4.6
3.8
18.2
18.7
1.0
0.9
Thermax
Neutral
983
-
11,712
4,125
4,747
10.3
10.8
26.7
31.5
36.8
31.2
4.1
3.8
11.2
12.0
2.6
2.2
VATech Wabag
Accumulate
599
681
3,268
3,867
4,126
9.6
10.0
34.9
39.8
17.2
15.0
2.8
2.4
17.7
17.5
0.9
0.8
Cement
ACC
Neutral
1,793
-
33,667
12,255
13,350
13.5
14.3
58.0
66.2
30.9
27.1
3.7
3.4
11.5
12.2
2.7
2.5
Ambuja Cements
Neutral
281
-
55,826
10,250
11,450
17.5
19.0
7.2
8.3
39.1
33.9
2.8
2.6
7.0
7.8
5.2
4.6
India Cements
Neutral
182
-
5,601
6,135
6,750
14.8
15.2
8.5
11.5
21.4
15.8
1.1
1.0
4.8
6.2
1.3
1.1
JK Cement
Neutral
959
-
6,704
4,150
4,775
19.2
20.0
49.0
63.5
19.6
15.1
3.1
2.7
17.0
18.5
2.1
1.7
J K Lakshmi Cement
Neutral
394
-
4,637
3,422
3,757
15.5
17.0
13.5
23.2
29.2
17.0
3.0
2.6
10.8
15.5
1.8
1.5
Orient Cement
Neutral
158
-
3,234
2,215
3,233
16.8
17.0
5.9
6.9
26.8
22.9
2.0
1.9
10.8
10.1
2.5
1.6
UltraTech Cement
Neutral
4,088
-
112,236
28,250
35,150
20.2
23.5
77.5
122.2
52.8
33.5
4.4
4.0
9.6
14.8
4.4
3.6
Construction
KNR Constructions
Neutral
215
-
3,021
1,846
2,203
14.5
14.5
12.1
13.7
17.8
15.7
1.0
0.8
17.5
16.7
1.7
1.4
Larsen & Toubro
Neutral
1,149
-
160,874
95,787
109,476
10.2
11.6
44.5
50.8
25.8
22.6
3.2
3.0
12.9
13.1
2.2
2.0
Gujarat Pipavav Port
Neutral
142
-
6,843
739
842
61.6
62.7
5.1
6.2
27.8
23.0
3.5
3.4
12.7
14.9
8.7
7.5
PNC Infratech
Neutral
157
-
4,037
2,040
2,935
13.0
13.0
6.4
9.0
24.6
17.5
0.6
0.6
9.7
12.2
2.0
1.4
Simplex Infra
Neutral
461
-
2,282
6,012
6,619
11.6
11.7
21.1
31.0
21.9
14.9
1.5
1.4
6.5
8.6
0.9
0.8
Sadbhav Engineering
Accumulate
279
298
4,778
3,823
4,426
10.7
10.8
10.3
11.8
27.0
23.6
3.2
2.8
10.1
10.5
1.6
1.4
NBCC
Neutral
250
-
22,523
9,099
12,706
6.4
6.4
7.3
9.6
34.4
26.2
1.5
1.2
27.5
30.5
2.3
1.7
MEP Infra
Neutral
100
-
1,628
2,403
2,910
18.3
16.8
2.4
6.1
42.6
16.5
16.2
10.9
35.2
55.8
1.8
1.5
SIPL
Neutral
99
-
3,480
2,060
2,390
46.8
47.7
(5.8)
(3.1)
3.7
4.2
(14.2)
(2.3)
6.5
6.0
Engineers India
Neutral
151
-
10,159
1,795
2,611
21.1
22.4
5.9
8.1
25.6
18.6
1.8
1.8
12.9
16.1
4.0
2.6
Financials
Axis Bank
Accumulate
513
580
123,045
32,558
35,843
3.5
3.2
27.8
41.0
18.5
12.5
2.0
1.8
11.4
14.9
-
-
Bank of Baroda
Neutral
139
-
32,039
22,533
26,079
2.4
2.4
12.0
20.9
11.6
6.7
0.8
0.7
6.6
11.0
-
-
Canara Bank
Neutral
309
-
18,441
17,925
20,235
2.0
2.1
18.5
36.5
16.7
8.5
0.6
0.6
3.4
6.2
-
-
Can Fin Homes
Buy
552
2,128
7,341
586
741
3.5
3.5
107.8
141.0
5.1
3.9
1.1
0.9
24.1
25.6
-
-
Cholamandalam Inv. &
Accumulate
1,131
1,230
17,681
2,826
3,307
6.3
6.3
53.7
64.6
21.1
17.5
3.6
3.1
18.3
18.9
-
-
Fin. Co.
Dewan Housing Finance Accumulate
592
630
18,557
2,676
3,383
2.4
2.7
37.4
49.7
15.8
11.9
2.1
1.8
13.8
16.2
-
-
Equitas Holdings
Buy
156
235
5,277
1,125
1,380
9.6
9.8
1.5
6.0
103.8
26.0
2.4
2.2
2.4
8.2
-
-
Federal Bank
Neutral
126
-
24,526
4,896
5,930
2.8
3.1
5.4
7.6
23.5
16.6
2.0
1.8
8.5
11.0
-
-
Stock Watch
October 18, 2017
Company Name
Reco
CMP
Target
Mkt Cap
Sales ( Čcr )
OPM(%)
EPS (Č)
PER(x)
P/BV(x)
RoE(%)
EV/Sales(x)
(Č)
Price ( Č)
( Č cr )
FY18E FY19E
FY18E
FY19E
FY18E
FY19E
FY18E
FY19E
FY18E
FY19E
FY18E
FY19E
FY18E
FY19E
Financials
GIC Housing
Buy
505
655
2,719
376
477
3.6
3.7
33.0
40.0
15.3
12.6
2.7
2.3
20.0
23.0
-
-
HDFC Bank
Neutral
1,851
-
477,777
55,236
63,253
4.5
4.4
68.9
82.4
26.9
22.5
4.7
3.9
18.7
18.5
-
-
ICICI Bank
Buy
274
315
175,738
42,361
51,378
3.6
3.9
18.4
25.7
14.9
10.7
1.6
1.6
11.3
15.0
-
-
Karur Vysya Bank
Buy
128
180
7,717
3,289
3,630
3.7
3.9
10.8
14.1
11.8
9.1
1.4
1.3
12.5
14.7
-
-
LIC Housing Finance
Neutral
670
-
33,790
4,895
6,332
3.4
3.7
50.7
66.8
13.2
10.0
2.6
2.2
21.7
23.8
-
-
Punjab Natl.Bank
Neutral
135
-
28,621
23,708
25,758
2.1
2.1
5.9
16.4
22.9
8.2
0.7
0.6
3.0
8.3
-
-
RBL Bank
Neutral
522
-
21,559
2,309
2,888
2.6
2.5
16.4
19.1
31.9
27.4
4.0
3.6
13.3
13.8
-
-
Repco Home Finance
Buy
645
825
4,037
496
597
4.4
4.2
38.5
48.7
16.8
13.2
3.0
2.5
19.6
20.6
-
-
South Ind.Bank
Neutral
32
-
5,801
3,195
3,567
3.0
3.1
3.0
3.8
10.7
8.4
1.1
0.9
10.5
11.9
-
-
St Bk of India
Neutral
251
-
216,794
105,827
121,056
2.4
2.5
16.1
25.6
15.6
9.8
1.2
1.1
6.6
9.9
-
-
Union Bank
Neutral
128
-
9,284
14,650
16,225
2.3
2.3
23.1
32.5
5.5
3.9
0.4
0.4
7.1
9.2
-
-
Yes Bank
Neutral
373
-
85,491
11,088
13,138
3.0
2.9
84.0
99.3
4.4
3.8
0.7
0.6
16.3
16.8
-
-
FMCG
Akzo Nobel India
Neutral
1,831
-
8,782
3,164
3,607
13.8
13.7
58.6
67.9
31.3
27.0
7.7
6.8
24.5
25.1
2.6
2.3
Asian Paints
Neutral
1,194
-
114,567
17,603
20,615
18.6
18.6
2,128.9
2,543.3
0.6
0.5
11.8
10.0
28.0
28.9
6.3
5.3
Britannia
Neutral
4,620
-
55,461
9,690
11,278
14.8
15.4
84.0
101.0
55.0
45.7
20.0
15.9
40.6
39.0
5.7
4.9
Colgate
Neutral
1,043
-
28,374
4,420
5,074
24.9
25.3
28.6
32.8
36.5
31.8
14.4
11.6
43.8
40.5
6.2
5.3
Dabur India
Neutral
320
-
56,333
8,346
9,344
19.6
19.9
7.8
9.0
41.0
35.5
8.3
7.5
25.2
24.8
6.4
5.6
GlaxoSmith Con*
Neutral
4,956
-
20,841
5,072
5,760
18.2
18.4
176.3
199.2
28.1
24.9
6.0
5.4
21.2
21.7
3.4
3.0
Godrej Consumer
Neutral
970
-
66,062
10,171
11,682
20.8
21.5
21.7
27.1
44.7
35.8
10.1
8.6
22.3
23.4
6.6
5.7
HUL
Neutral
1,280
-
276,988
37,077
41,508
20.3
21.8
5,189.9
6,318.5
0.3
0.2
39.0
33.3
74.8
82.0
7.3
6.5
ITC
Neutral
267
-
325,458
44,588
49,853
37.0
37.3
9.6
11.0
27.8
24.3
6.8
6.5
25.1
27.3
6.8
6.0
Marico
Neutral
322
-
41,502
6,788
7,766
18.5
19.2
7.1
8.5
45.3
37.8
15.8
13.6
36.9
38.0
6.0
5.2
Nestle*
Neutral
7,365
-
71,014
10,083
11,182
20.0
20.9
119.7
141.3
61.5
52.1
216.9
198.2
36.7
39.8
6.7
6.0
Tata Global
Neutral
210
-
13,273
7,121
7,641
11.9
12.3
6.9
8.0
30.5
26.3
2.0
1.9
6.8
7.2
1.7
1.5
Procter & Gamble
Neutral
8,660
-
28,111
3,034
3,579
27.1
27.7
167.7
198.8
51.6
43.6
13.9
11.9
28.8
29.5
8.7
7.3
Hygiene
IT
HCL Tech^
Accumulate
921
1,014
131,426
52,342
57,053
20.9
20.9
62.8
67.6
14.7
13.6
3.3
2.8
22.4
20.6
2.2
1.9
Infosys
Buy
931
1,179
213,951
73,963
80,619
26.0
26.0
64.4
69.3
14.5
13.4
2.9
2.6
19.7
19.6
2.3
2.1
TCS
Neutral
2,595
-
511,297
127,403
138,870
27.6
27.6
144.5
156.0
18.0
16.6
5.3
5.0
29.7
29.8
3.7
3.3
Tech Mahindra
Accumulate
472
533
46,048
31,015
33,496
15.0
15.0
35.6
38.1
13.3
12.4
2.3
2.1
17.0
16.3
1.3
1.1
Stock Watch
October 18, 2017
Company Name
Reco
CMP
Target
Mkt Cap
Sales ( Čcr )
OPM(%)
EPS (Č)
PER(x)
P/BV(x)
RoE(%)
EV/Sales(x)
(Č)
Price ( Č)
( Č cr )
FY18E FY19E
FY18E
FY19E
FY18E
FY19E
FY18E
FY19E
FY18E
FY19E
FY18E
FY19E
FY18E
FY19E
IT
Wipro
Neutral
290
-
140,891
58,536
61,858
20.3
20.3
18.2
19.1
15.9
15.2
2.5
2.1
14.6
13.4
2.3
2.2
Media
D B Corp
Neutral
369
-
6,778
2,404
2,625
30.5
31.5
23.7
26.9
15.6
13.7
3.7
3.1
23.5
22.8
2.7
2.4
HT Media
Neutral
102
-
2,383
2,589
2,830
15.1
15.4
8.3
10.9
12.3
9.4
1.0
0.9
8.4
10.4
0.5
0.3
Jagran Prakashan
Buy
172
225
5,638
2,541
2,835
28.5
28.7
12.7
14.1
13.6
12.2
2.8
2.4
21.3
21.4
2.1
1.8
Sun TV Network
Neutral
816
-
32,157
3,238
3,789
51.9
55.1
30.9
38.0
26.4
21.5
7.5
6.6
30.0
31.0
9.4
8.0
Hindustan Media
Neutral
245
-
1,798
1,002
1,074
23.3
23.5
29.2
33.8
8.4
7.3
1.3
1.1
15.6
15.4
0.8
0.5
Ventures
TV Today Network
Buy
353
435
2,105
667
727
27.7
27.7
18.6
20.1
19.0
17.6
3.0
3.0
15.6
17.3
2.7
2.5
Music Broadcast Limited Accumulate
386
434
2,204
271
317
91.0
109.0
6.0
10.0
64.4
38.6
4.0
3.7
6.5
9.3
7.7
6.4
Metals & Mining
Coal India
Neutral
290
-
180,015
82,301
91,235
17.0
18.0
17.1
20.5
17.0
14.2
3.2
3.0
45.0
55.0
1.9
1.7
Hind. Zinc
Neutral
327
-
138,062
22,108
24,555
57.0
58.0
22.1
26.3
14.8
12.4
4.8
3.9
32.0
35.0
5.3
4.4
Hindalco
Neutral
276
-
61,946
102,350
105,355
13.5
14.5
21.5
24.5
12.8
11.3
1.8
1.5
15.0
15.2
1.2
1.1
JSW Steel
Neutral
260
-
62,787
64,500
68,245
21.1
21.5
20.1
21.2
12.9
12.3
2.4
2.0
-
-
1.7
1.6
NMDC
Neutral
123
-
39,042
10,209
11,450
47.0
48.0
11.1
12.1
11.1
10.2
1.5
1.5
-
-
3.3
3.0
SAIL
Neutral
59
-
24,429
54,100
63,555
3.0
10.0
(10.0)
1.5
39.4
0.8
0.8
-
-
1.4
1.2
Vedanta
Neutral
334
-
124,284
81,206
87,345
28.0
29.0
26.5
33.5
12.6
10.0
2.9
2.5
-
-
2.3
2.0
Tata Steel
Neutral
712
-
69,194
121,445
126,500
16.2
17.2
65.4
81.3
10.9
8.8
1.7
1.5
-
-
1.1
1.0
Oil & Gas
GAIL
Neutral
437
-
73,935
53,115
52,344
14.2
15.3
30.0
31.1
14.6
14.1
1.8
1.7
-
-
1.1
1.1
ONGC
Neutral
171
-
219,705
83,111
84,934
44.2
44.9
16.4
16.9
10.4
10.1
1.3
1.2
-
-
2.5
2.5
Indian Oil Corp
Neutral
414
-
200,986
396,116
432,560
8.5
8.8
40.1
42.2
10.3
9.8
1.8
1.6
-
-
0.7
0.6
Reliance Industries
Neutral
874
-
568,595
257,711
267,438
17.0
18.2
89.1
89.5
9.8
9.8
0.9
0.9
-
-
1.9
1.8
Pharmaceuticals
Alembic Pharma
Buy
499
600
9,398
3,903
4,584
18.2
19.2
21.8
27.2
22.9
18.3
4.2
3.5
19.8
20.6
2.4
2.1
Alkem Laboratories Ltd
Accumulate
1,824
2,079
21,809
6,320
7,341
17.5
19.8
72.7
96.6
25.1
18.9
4.4
3.7
16.7
18.7
3.4
2.9
Aurobindo Pharma
Accumulate
763
823
44,712
17,086
19,478
22.1
22.0
44.7
51.4
17.1
14.9
3.8
3.1
24.7
22.7
2.7
2.4
Aventis*
Neutral
4,210
-
9,696
2,508
2,862
16.8
16.8
139.9
153.8
30.1
27.4
4.4
3.5
23.5
25.8
3.5
2.9
Cadila Healthcare
Reduce
497
426
50,875
11,584
13,228
20.3
20.4
18.7
21.3
26.6
23.3
5.9
4.9
24.6
22.9
4.2
3.6
Cipla
Sell
631
458
50,796
16,619
19,437
15.4
16.2
19.7
24.3
32.0
26.0
3.6
3.2
12.0
13.2
3.2
2.7
Dr Reddy's
Neutral
2,382
-
39,497
15,844
17,973
17.6
18.2
91.7
111.0
26.0
21.5
3.0
2.7
11.9
13.0
2.7
2.4
GSK Pharma*
Neutral
2,443
-
20,697
3,260
3,651
15.0
18.0
46.1
58.6
53.0
41.7
10.9
11.2
20.0
26.5
6.2
5.7
Indoco Remedies
Sell
258
153
2,381
1,154
1,310
14.9
14.9
11.3
12.7
22.9
20.4
3.3
2.9
15.0
15.0
2.2
1.9
Stock Watch
October 18, 2017
Company Name
Reco
CMP
Target
Mkt Cap
Sales ( Čcr )
OPM(%)
EPS (Č)
PER(x)
P/BV(x)
RoE(%)
EV/Sales(x)
(Č)
Price ( Č)
( Č cr )
FY18E FY19E
FY18E
FY19E
FY18E
FY19E
FY18E
FY19E
FY18E
FY19E
FY18E
FY19E
FY18E
FY19E
Pharmaceuticals
Ipca labs
Accumulate
496
540
6,256
3,593
4,022
14.5
15.5
19.4
25.2
25.6
19.7
2.3
2.1
9.5
11.2
1.8
1.6
Lupin
Buy
1,067
1,467
48,191
18,657
21,289
21.3
23.3
52.8
66.7
20.2
16.0
3.1
2.6
16.3
17.5
2.6
2.2
Natco Pharma
Accumulate
986
1,057
17,183
1,886
2,016
32.3
29.5
23.2
22.0
42.6
44.7
8.9
7.9
20.9
17.6
9.0
8.4
Sun Pharma
Neutral
547
-
131,287
32,899
36,451
26.9
25.4
31.6
32.3
17.3
16.9
3.1
2.7
18.7
18.8
3.6
3.1
Syngene International
Accumulate
494
557
9,879
1,402
1,823
32.8
36.0
15.9
20.7
31.1
23.9
5.8
4.8
18.7
20.0
7.0
5.4
Power
Tata Power
Neutral
82
-
22,071
32,547
33,806
20.5
20.5
4.7
5.4
17.4
15.3
1.7
1.4
10.5
10.5
1.7
1.6
NTPC
Neutral
176
-
145,079
86,070
101,246
28.3
30.7
12.9
16.2
13.6
10.9
1.4
1.3
10.6
12.4
3.0
2.7
Power Grid
Accumulate
205
223
107,195
29,183
32,946
89.7
90.0
18.0
20.8
11.4
9.9
1.9
1.7
17.7
18.2
7.6
7.1
Real Estate
Prestige Estate
Neutral
285
-
10,703
4,607
5,146
21.0
22.2
7.9
9.8
36.1
29.1
2.2
2.1
10.3
12.0
3.5
3.2
MLIFE
Buy
453
522
2,324
487
590
12.3
17.8
21.0
31.2
21.6
14.5
1.1
1.1
5.2
7.4
3.5
2.8
Telecom
Bharti Airtel
Neutral
466
-
186,259
97,903
105,233
36.0
36.3
9.3
11.1
50.1
42.2
2.4
2.3
5.0
5.6
2.9
2.6
Idea Cellular
Neutral
90
-
32,462
35,012
37,689
27.1
27.7
(4.4)
(2.7)
1.4
1.5
(6.8)
(4.6)
2.2
2.0
zOthers
Abbott India
Neutral
4,225
-
8,978
3,244
3,723
14.9
16.1
167.5
209.4
25.2
20.2
5.6
4.7
23.7
24.8
2.4
2.0
Asian Granito
Buy
489
570
1,471
1,169
1,286
12.5
12.5
16.0
19.7
30.6
24.8
3.3
2.9
10.7
11.6
1.5
1.3
Bajaj Electricals
Neutral
416
-
4,219
4,646
5,301
6.7
7.6
16.1
22.3
25.8
18.6
4.2
3.6
16.4
19.2
0.9
0.8
Banco Products (India)
Neutral
222
-
1,586
1,530
1,695
13.2
12.7
19.0
20.0
11.7
11.1
1.9
1.7
0.2
0.2
0.9
105.2
Coffee Day Enterprises
Neutral
222
-
4,572
3,494
3,913
17.4
18.0
4.8
5.7
-
39.0
2.0
1.9
-
0.1
1.8
1.6
Ltd
Elecon Engineering
Neutral
67
-
755
171
201
15.0
16.2
36.0
43.0
1.9
1.6
0.2
0.1
0.1
0.1
3.8
3.2
Garware Wall Ropes
Neutral
899
-
1,967
928
1,003
15.2
15.2
39.4
43.2
22.8
20.8
3.8
3.2
16.5
15.4
2.0
1.8
Goodyear India*
Neutral
815
-
1,879
1,717
1,866
11.8
12.3
47.9
49.8
17.0
16.4
2.6
2.3
15.6
15.7
0.8
113.0
Hitachi
Neutral
2,450
-
6,662
2,355
2,715
10.3
10.8
49.0
60.9
50.0
40.2
11.7
9.3
0.2
0.2
2.9
2.5
HSIL
Neutral
429
-
3,101
2,240
2,670
14.6
15.0
17.0
22.0
25.2
19.5
2.1
2.0
0.1
0.1
1.6
1.3
Interglobe Aviation
Neutral
1,110
-
40,131
22,570
27,955
14.2
15.0
63.6
81.8
17.5
13.6
9.2
7.8
0.5
0.6
1.5
1.1
Jyothy Laboratories
Neutral
388
-
7,041
1,781
2,044
14.1
15.0
9.4
10.5
41.5
36.9
8.8
8.3
0.2
0.2
4.2
3.6
Linc Pen & Plastics
Neutral
246
-
364
420
462
9.3
9.3
15.3
17.1
16.1
14.4
2.7
2.8
16.9
19.5
0.9
0.8
M M Forgings
Neutral
835
-
1,008
542
642
20.1
21.0
41.6
56.8
20.1
14.7
2.8
2.3
0.1
0.2
2.3
2.0
Mirza International
Neutral
159
-
1,912
1,148
1,285
18.0
18.0
8.0
9.4
19.8
17.0
3.3
2.8
16.3
16.1
1.8
1.6
Navkar Corporation
Buy
194
265
2,759
561
617
41.5
41.5
11.5
12.7
16.8
15.2
1.8
1.6
10.5
10.4
5.6
4.9
Nilkamal
Neutral
1,621
-
2,420
2,317
2,525
11.4
11.1
96.0
105.0
16.9
15.4
2.9
2.5
0.2
0.2
1.0
0.9
Stock Watch
October 18, 2017
Company Name
Reco
CMP
Target Mkt Cap
Sales ( Čcr )
OPM(%)
EPS (Č)
PER(x)
P/BV(x)
RoE(%)
EV/Sales(x)
(Č)
Price ( Č)
( Č cr )
FY18E FY19E FY18E FY19E FY18E FY19E FY18E FY19E FY18E FY19E FY18E FY19E FY18E FY19E
zOthers
Parag Milk Foods
Neutral
268
-
2,258
1,987
2,379
7.6
9.0
12.4
18.3
21.7
14.7
3.1
2.7
8.2
13.2
1.3
1.1
Radico Khaitan
Neutral
215
-
2,861
1,811
1,992
13.2
13.2
8.1
8.8
26.5
24.4
2.7
2.9
10.1
12.0
1.9
1.7
Relaxo Footwears
Neutral
519
-
6,234
1,981
2,310
13.7
14.5
12.0
15.5
43.3
33.5
8.4
6.8
0.2
0.2
3.2
2.8
Siyaram Silk Mills
Accumulate
2,674
2,856
2,506
1,769
1,981
12.7
12.7
113.1
131.1
23.6
20.4
3.7
3.2
15.5
15.5
1.6
1.4
Styrolution ABS India* Neutral
1,048
-
1,844
1,800
1,980
8.0
8.1
42.0
46.2
25.0
22.7
2.8
2.5
0.1
0.1
1.1
1.0
Surya Roshni
Neutral
309
-
1,353
4,870
5,320
7.7
7.8
22.8
28.1
13.6
11.0
1.8
1.6
0.1
0.1
0.5
0.4
TVS Srichakra
Neutral
3,101
-
2,374
2,729
2,893
12.7
12.5
248.5
265.0
12.5
11.7
3.5
2.9
0.3
0.3
0.9
0.8
Visaka Industries
Neutral
713
-
1,132
1,104
1,214
12.1
12.6
31.0
37.9
23.0
18.8
2.8
2.5
0.1
0.1
1.3
1.1
VIP Industries
Accumulate
262
300
3,705
1,450
1,693
10.4
10.5
6.5
7.8
40.1
33.6
8.5
7.4
21.1
22.1
2.5
2.2
Navin Fluorine
Neutral
705
-
3,474
945
1,154
22.4
22.6
28.7
34.8
24.6
20.3
4.1
3.5
-
-
3.2
2.5
Source: Company, Angel Research; Note: *December year end; #September year end; &October year end; Price as on October 17, 2017
Market Outlook
October 18, 2017
Research Team Tel: 022 - 39357800
DISCLAIMER
Angel Broking Private Limited (hereinafter referred to as “Angel”) is a registered Member of National Stock Exchange of India
Limited,Bombay Stock Exchange Limited and Metropolitan Stock Exchange Limited. It is also registered as a Depository Participant with
CDSL and Portfolio Manager with SEBI. It also has registration with AMFI as a Mutual Fund Distributor. Angel Broking Private Limited is a
registered entity with SEBI for Research Analyst in terms of SEBI (Research Analyst) Regulations, 2014 vide registration number
INH000000164. Angel or its associates has not been debarred/ suspended by SEBI or any other regulatory authority for accessing
/dealing in securities Market. Angel or its associates/analyst has not received any compensation / managed or
co-managed public offering of securities of the company covered by Analyst during the past twelve months.
This document is solely for the personal information of the recipient, and must not be singularly used as the basis of any investment
decision. Nothing in this document should be construed as investment or financial advice. Each recipient of this document should make
such investigations as they deem necessary to arrive at an independent evaluation of an investment in the securities of the companies
referred to in this document (including the merits and risks involved), and should consult their own advisors to determine the merits and
risks of such an investment.
Reports based on technical and derivative analysis center on studying charts of a stock's price movement, outstanding positions and
trading volume, as opposed to focusing on a company's fundamentals and, as such, may not match with a report on a company's
fundamentals. Investors are advised to refer the Fundamental and Technical Research Reports available on our website to evaluate the
contrary view, if any.
The information in this document has been printed on the basis of publicly available information, internal data and other reliable
sources believed to be true, but we do not represent that it is accurate or complete and it should not be relied on as such, as this
document is for general guidance only. Angel Broking Pvt. Limited or any of its affiliates/ group companies shall not be in any way
responsible for any loss or damage that may arise to any person from any inadvertent error in the information contained in this report.
Angel Broking Pvt. Limited has not independently verified all the information contained within this document. Accordingly, we cannot
testify, nor make any representation or warranty, express or implied, to the accuracy, contents or data contained within this document.
While Angel Broking Pvt. Limited endeavors to update on a reasonable basis the information discussed in this material, there may be
regulatory, compliance, or other reasons that prevent us from doing so.
This document is being supplied to you solely for your information, and its contents, information or data may not be reproduced,
redistributed or passed on, directly or indirectly.
Neither Angel Broking Pvt. Limited, nor its directors, employees or affiliates shall be liable for any loss or damage that may arise from
or in connection with the use of this information.